
This page shows you how to orchestrate the deployment, management, and monitoring of an insecure 3-node CockroachDB cluster in a single Kubernetes cluster, using the StatefulSet feature.
To deploy across multiple Kubernetes clusters in different geographic regions instead, see Kubernetes Multi-Cluster Deployment. Also, for details about potential performance bottlenecks to be aware of when running CockroachDB in Kubernetes and guidance on how to optimize your deployment for better performance, see CockroachDB Performance on Kubernetes.
Before you begin
Before getting started, it's helpful to review some Kubernetes-specific terminology and current limitations.
Kubernetes terminology
| Feature | Description |
|---|---|
| instance | A physical or virtual machine. In this tutorial, you'll create GCE or AWS instances and join them into a single Kubernetes cluster from your local workstation. |
| pod | A pod is a group of one or more Docker containers. In this tutorial, each pod will run on a separate instance and include one Docker container running a single CockroachDB node. You'll start with 3 pods and grow to 4. |
| StatefulSet | A StatefulSet is a group of pods treated as stateful units, where each pod has distinguishable network identity and always binds back to the same persistent storage on restart. StatefulSets are considered stable as of Kubernetes version 1.9 after reaching beta in version 1.5. |
| persistent volume | A persistent volume is a piece of networked storage (Persistent Disk on GCE, Elastic Block Store on AWS) mounted into a pod. The lifetime of a persistent volume is decoupled from the lifetime of the pod that's using it, ensuring that each CockroachDB node binds back to the same storage on restart. This tutorial assumes that dynamic volume provisioning is available. When that is not the case, persistent volume claims need to be created manually. |
Limitations
Kubernetes version
Kubernetes 1.18 or higher is required in order to use our most up-to-date configuration files. Earlier Kubernetes releases do not support some of the options used in our configuration files. If you need to run on an older version of Kubernetes, we have kept around configuration files that work on older Kubernetes releases in the versioned subdirectories of https://github.com/cockroachdb/cockroach/tree/master/cloud/kubernetes (e.g., v1.7).
Storage
At this time, orchestrations of CockroachDB with Kubernetes use external persistent volumes that are often replicated by the provider. Because CockroachDB already replicates data automatically, this additional layer of replication is unnecessary and can negatively impact performance. High-performance use cases on a private Kubernetes cluster may want to consider using local volumes.
Step 1. Start Kubernetes
Choose whether you want to orchestrate CockroachDB with Kubernetes using the hosted Google Kubernetes Engine (GKE) service or manually on Google Compute Engine (GCE) or AWS. The instructions below will change slightly depending on your choice.
Complete the Before You Begin steps described in the Google Kubernetes Engine Quickstart documentation.
This includes installing
gcloud, which is used to create and delete Kubernetes Engine clusters, andkubectl, which is the command-line tool used to manage Kubernetes from your workstation.Tip:The documentation offers the choice of using Google's Cloud Shell product or using a local shell on your machine. Choose to use a local shell if you want to be able to view the CockroachDB Admin UI using the steps in this guide.
From your local workstation, start the Kubernetes cluster:
$ gcloud container clusters create cockroachdbCreating cluster cockroachdb...done.This creates GKE instances and joins them into a single Kubernetes cluster named
cockroachdb.The process can take a few minutes, so do not move on to the next step until you see a
Creating cluster cockroachdb...donemessage and details about your cluster.Get the email address associated with your Google Cloud account:
$ gcloud info | grep AccountAccount: [your.google.cloud.email@example.org]Warning:This command returns your email address in all lowercase. However, in the next step, you must enter the address using the accurate capitalization. For example, if your address is YourName@example.com, you must use YourName@example.com and not yourname@example.com.
Create the RBAC roles CockroachDB needs for running on GKE, using the address from the previous step:
$ kubectl create clusterrolebinding $USER-cluster-admin-binding --clusterrole=cluster-admin --user=<your.google.cloud.email@example.org>clusterrolebinding "cluster-admin-binding" created
From your local workstation, install prerequisites and start a Kubernetes cluster as described in the Running Kubernetes on Google Compute Engine documentation.
The process includes:
- Creating a Google Cloud Platform account, installing
gcloud, and other prerequisites. - Downloading and installing the latest Kubernetes release.
- Creating GCE instances and joining them into a single Kubernetes cluster.
- Installing
kubectl, the command-line tool used to manage Kubernetes from your workstation.
From your local workstation, install prerequisites and start a Kubernetes cluster as described in the Running Kubernetes on AWS EC2 documentation.
Step 2. Start CockroachDB nodes
From your local workstation, use our
cockroachdb-statefulset.yamlfile to create the StatefulSet that automatically creates 3 pods, each with a CockroachDB node running inside it:$ kubectl create -f https://raw.githubusercontent.com/cockroachdb/cockroach/master/cloud/kubernetes/cockroachdb-statefulset.yamlservice "cockroachdb-public" created service "cockroachdb" created poddisruptionbudget "cockroachdb-budget" created statefulset "cockroachdb" createdAlternatively, if you'd rather start with a configuration file that has been customized for performance:
Download our performance version of
cockroachdb-statefulset-insecure.yaml:$ curl -O https://raw.githubusercontent.com/cockroachdb/cockroach/master/cloud/kubernetes/performance/cockroachdb-statefulset-insecure.yamlModify the file wherever there is a
TODOcomment.Use the file to create the StatefulSet and start the cluster:
$ kubectl create -f cockroachdb-statefulset-insecure.yaml
Confirm that three pods are
Runningsuccessfully. Note that they will not be consideredReadyuntil after the cluster has been initialized:$ kubectl get podsNAME READY STATUS RESTARTS AGE cockroachdb-0 0/1 Running 0 2m cockroachdb-1 0/1 Running 0 2m cockroachdb-2 0/1 Running 0 2mConfirm that the persistent volumes and corresponding claims were created successfully for all three pods:
$ kubectl get persistentvolumesNAME CAPACITY ACCESSMODES RECLAIMPOLICY STATUS CLAIM REASON AGE pvc-52f51ecf-8bd5-11e6-a4f4-42010a800002 1Gi RWO Delete Bound default/datadir-cockroachdb-0 26s pvc-52fd3a39-8bd5-11e6-a4f4-42010a800002 1Gi RWO Delete Bound default/datadir-cockroachdb-1 27s pvc-5315efda-8bd5-11e6-a4f4-42010a800002 1Gi RWO Delete Bound default/datadir-cockroachdb-2 27s
Step 3. Initialize the cluster
Use our
cluster-init.yamlfile to perform a one-time initialization that joins the nodes into a single cluster:$ kubectl create -f https://raw.githubusercontent.com/cockroachdb/cockroach/master/cloud/kubernetes/cluster-init.yamljob "cluster-init" createdConfirm that cluster initialization has completed successfully. The job should be considered successful and the CockroachDB pods should soon be considered
Ready:$ kubectl get job cluster-initNAME DESIRED SUCCESSFUL AGE cluster-init 1 1 2m$ kubectl get podsNAME READY STATUS RESTARTS AGE cockroachdb-0 1/1 Running 0 3m cockroachdb-1 1/1 Running 0 3m cockroachdb-2 1/1 Running 0 3m
The StatefulSet configuration sets all CockroachDB nodes to log to stderr, so if you ever need access to a pod/node's logs to troubleshoot, use kubectl logs <podname> rather than checking the log on the persistent volume.
Step 4. Use the built-in SQL client
Launch a temporary interactive pod and start the built-in SQL client inside it:
$ kubectl run cockroachdb -it --image=cockroachdb/cockroach --rm --restart=Never \
-- sql --insecure --host=cockroachdb-public
Run some basic CockroachDB SQL statements:
> CREATE DATABASE bank;> CREATE TABLE bank.accounts (id INT PRIMARY KEY, balance DECIMAL);> INSERT INTO bank.accounts VALUES (1, 1000.50);> SELECT * FROM bank.accounts;+----+---------+ | id | balance | +----+---------+ | 1 | 1000.5 | +----+---------+ (1 row)Exit the SQL shell and delete the temporary pod:
> \q
Step 5. Access the Admin UI
To access the cluster's Admin UI:
Port-forward from your local machine to one of the pods:
$ kubectl port-forward cockroachdb-0 8080Forwarding from 127.0.0.1:8080 -> 8080Note:Theport-forwardcommand must be run on the same machine as the web browser in which you want to view the Admin UI. If you have been running these commands from a cloud instance or other non-local shell, you will not be able to view the UI without configuringkubectllocally and running the aboveport-forwardcommand on your local machine.Go to http://localhost:8080.
In the UI, verify that the cluster is running as expected:
- Click View nodes list on the right to ensure that all nodes successfully joined the cluster.
- Click the Databases tab on the left to verify that
bankis listed.
Step 6. Simulate node failure
Based on the replicas: 3 line in the StatefulSet configuration, Kubernetes ensures that three pods/nodes are running at all times. When a pod/node fails, Kubernetes automatically creates another pod/node with the same network identity and persistent storage.
To see this in action:
Terminate one of the CockroachDB nodes:
$ kubectl delete pod cockroachdb-2pod "cockroachdb-2" deletedIn the Admin UI, the Summary panel will soon show one node as Suspect. As Kubernetes auto-restarts the node, watch how the node once again becomes healthy.
Back in the terminal, verify that the pod was automatically restarted:
$ kubectl get pod cockroachdb-2NAME READY STATUS RESTARTS AGE cockroachdb-2 1/1 Running 0 12s
Step 7. Set up monitoring and alerting
Despite CockroachDB's various built-in safeguards against failure, it is critical to actively monitor the overall health and performance of a cluster running in production and to create alerting rules that promptly send notifications when there are events that require investigation or intervention.
Configure Prometheus
Every node of a CockroachDB cluster exports granular timeseries metrics formatted for easy integration with Prometheus, an open source tool for storing, aggregating, and querying timeseries data. This section shows you how to orchestrate Prometheus as part of your Kubernetes cluster and pull these metrics into Prometheus for external monitoring.
This guidance is based on CoreOS's Prometheus Operator, which allows a Prometheus instance to be managed using built-in Kubernetes concepts.
Before starting, make sure the email address associated with your Google Cloud account is part of the cluster-admin RBAC group, as shown in Step 1. Start Kubernetes.
From your local workstation, edit the
cockroachdbservice to add theprometheus: cockroachdblabel:$ kubectl label svc cockroachdb prometheus=cockroachdbservice "cockroachdb" labeledThis ensures that there is a prometheus job and monitoring data only for the
cockroachdbservice, not for thecockroach-publicservice.Install CoreOS's Prometheus Operator:
$ kubectl apply -f https://raw.githubusercontent.com/coreos/prometheus-operator/release-0.20/bundle.yamlclusterrolebinding "prometheus-operator" created clusterrole "prometheus-operator" created serviceaccount "prometheus-operator" created deployment "prometheus-operator" createdConfirm that the
prometheus-operatorhas started:$ kubectl get deploy prometheus-operatorNAME DESIRED CURRENT UP-TO-DATE AVAILABLE AGE prometheus-operator 1 1 1 1 1mUse our
prometheus.yamlfile to create the various objects necessary to run a Prometheus instance:$ kubectl apply -f https://raw.githubusercontent.com/cockroachdb/cockroach/master/cloud/kubernetes/prometheus/prometheus.yamlclusterrole "prometheus" created clusterrolebinding "prometheus" created servicemonitor "cockroachdb" created prometheus "cockroachdb" createdAccess the Prometheus UI locally and verify that CockroachDB is feeding data into Prometheus:
Port-forward from your local machine to the pod running Prometheus:
$ kubectl port-forward prometheus-cockroachdb-0 9090Go to http://localhost:9090 in your browser.
To verify that each CockroachDB node is connected to Prometheus, go to Status > Targets. The screen should look like this:

To verify that data is being collected, go to Graph, enter the
sys_uptimevariable in the field, click Execute, and then click the Graph tab. The screen should like this: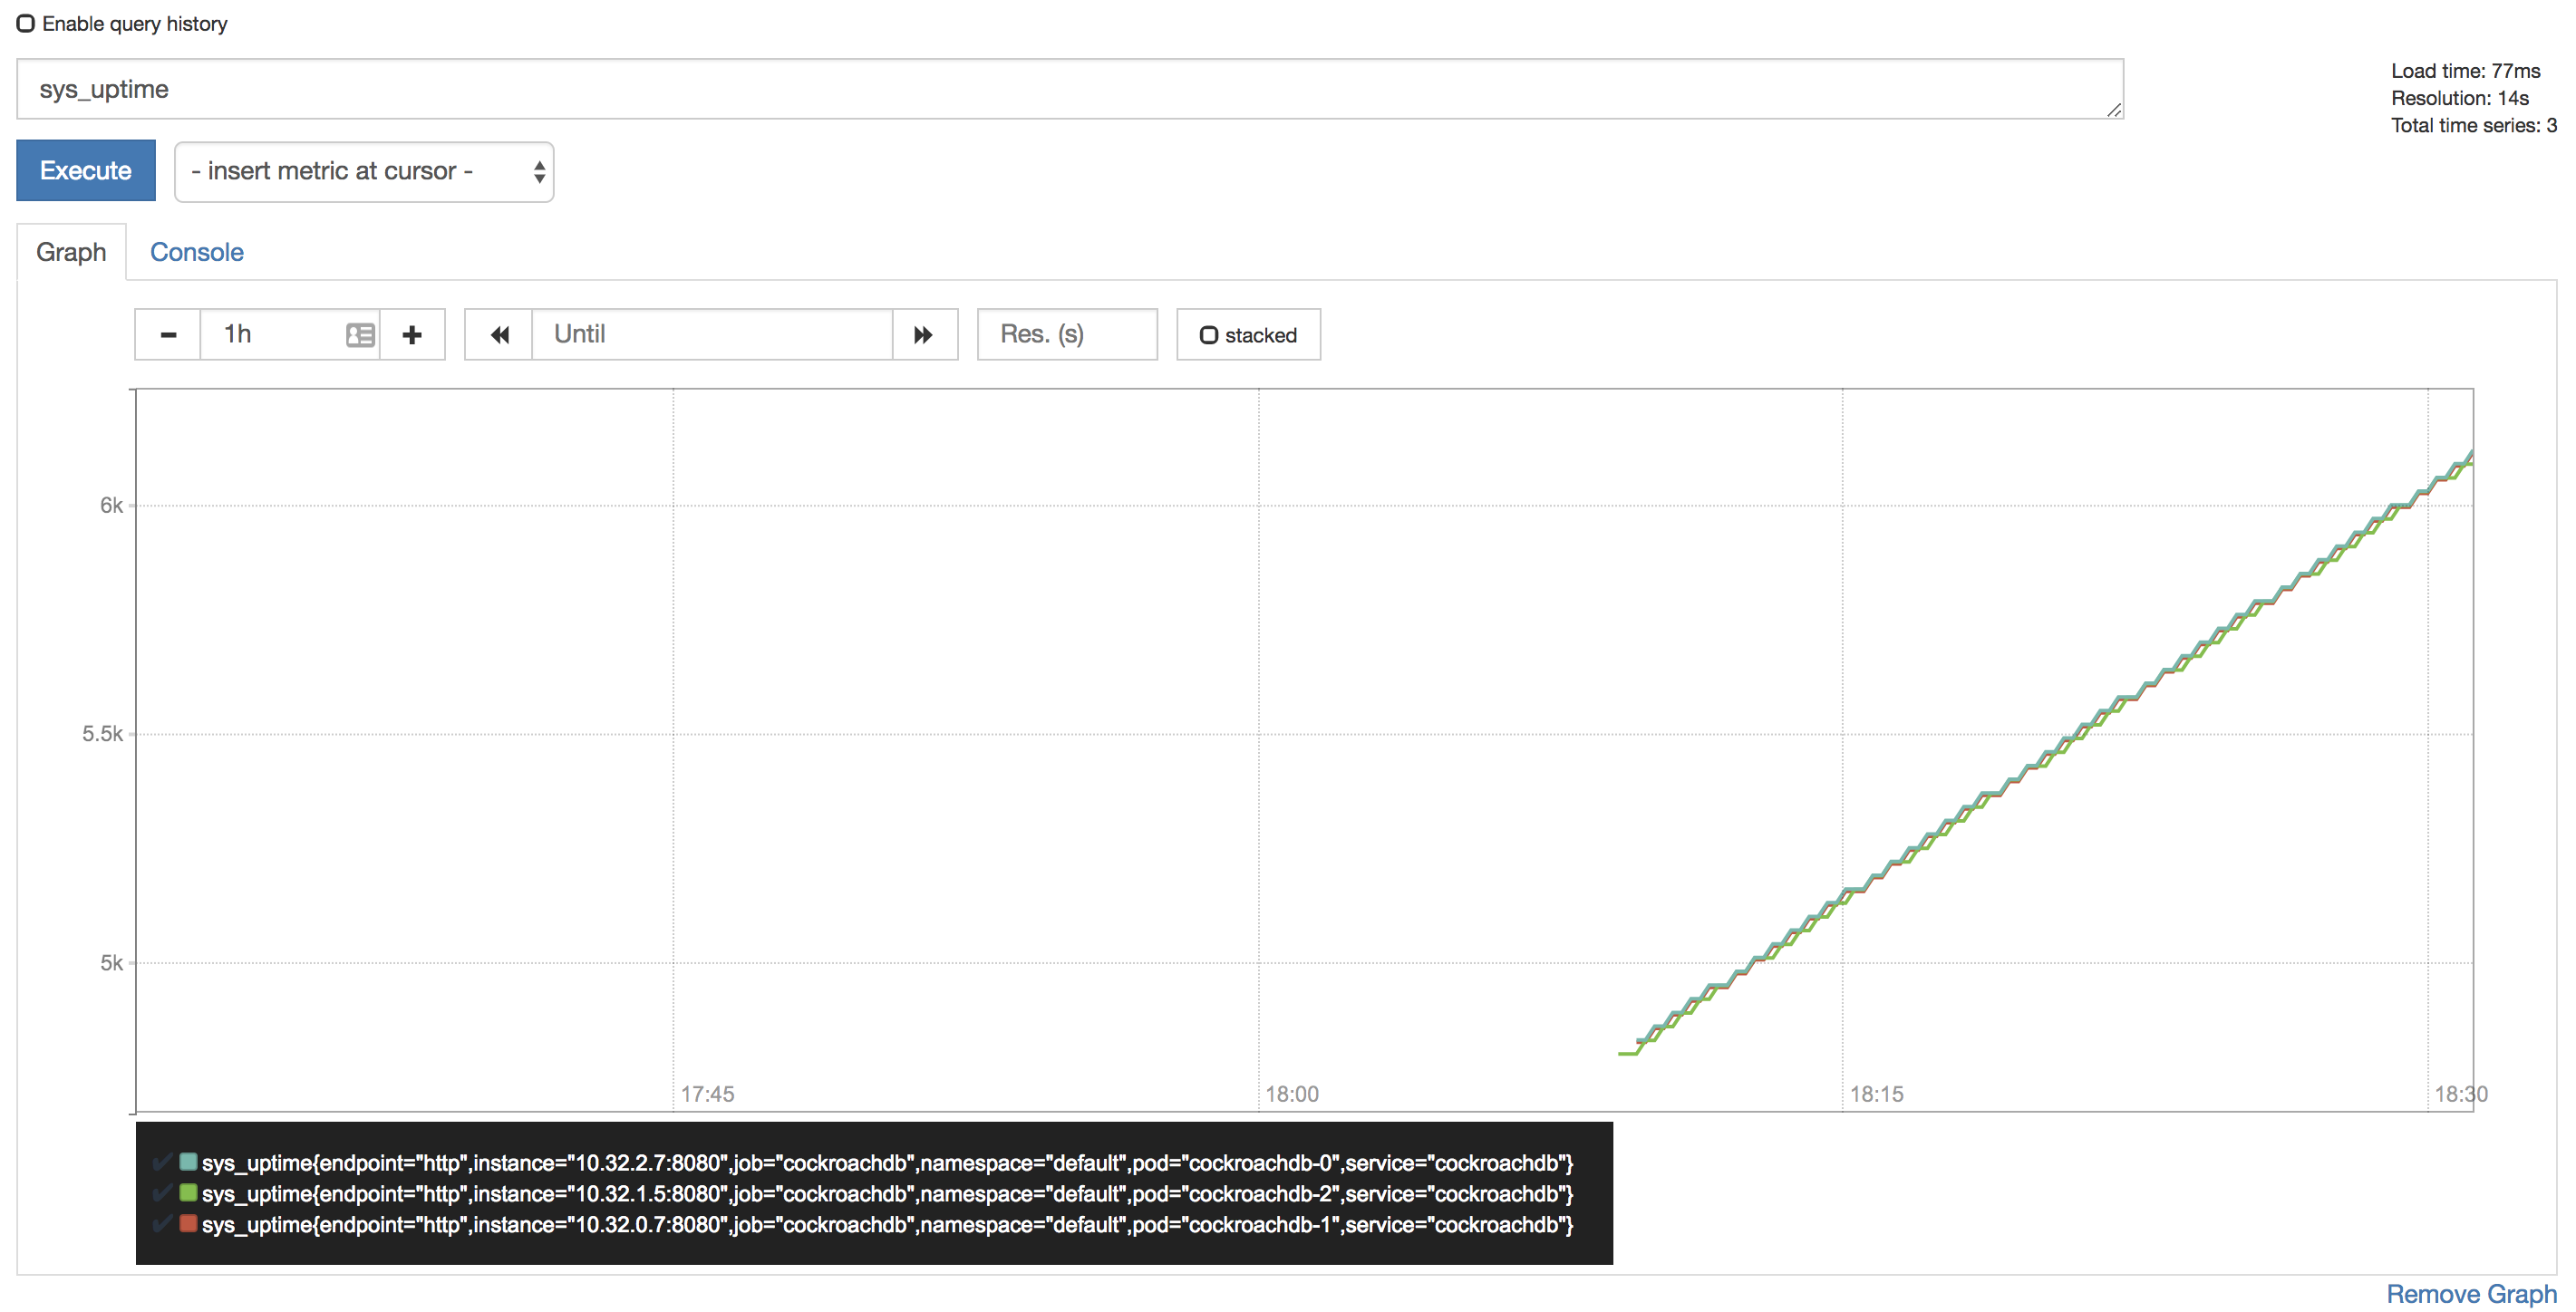
Tip:Prometheus auto-completes CockroachDB time series metrics for you, but if you want to see a full listing, with descriptions, port-forward as described in Access the Admin UI and then point your browser to http://localhost:8080/_status/vars.
For more details on using the Prometheus UI, see their official documentation.
Configure Alertmanager
Active monitoring helps you spot problems early, but it is also essential to send notifications when there are events that require investigation or intervention. This section shows you how to use Alertmanager and CockroachDB's starter alerting rules to do this.
Download our
alertmanager-config.yamlconfiguration file.Edit the
alertmanager-config.yamlfile to specify the desired receivers for notifications. Initially, the file contains a placeholder web hook.Add this configuration to the Kubernetes cluster as a secret, renaming it to
alertmanager.yamland labelling it to make it easier to find:$ kubectl create secret generic alertmanager-cockroachdb --from-file=alertmanager.yaml=alertmanager-config.yamlsecret "alertmanager-cockroachdb" created$ kubectl label secret alertmanager-cockroachdb app=cockroachdbsecret "alertmanager-cockroachdb" labeledWarning:The name of the secret,
alertmanager-cockroachdb, must match the name used in thealtermanager.yamlfile. If they differ, the Alertmanager instance will start without configuration, and nothing will happen.Use our
alertmanager.yamlfile to create the various objects necessary to run an Alertmanager instance, including a ClusterIP service so that Prometheus can forward alerts:$ kubectl apply -f https://raw.githubusercontent.com/cockroachdb/cockroach/master/cloud/kubernetes/prometheus/alertmanager.yamlalertmanager "cockroachdb" created service "alertmanager-cockroachdb" createdVerify that Alertmanager is running:
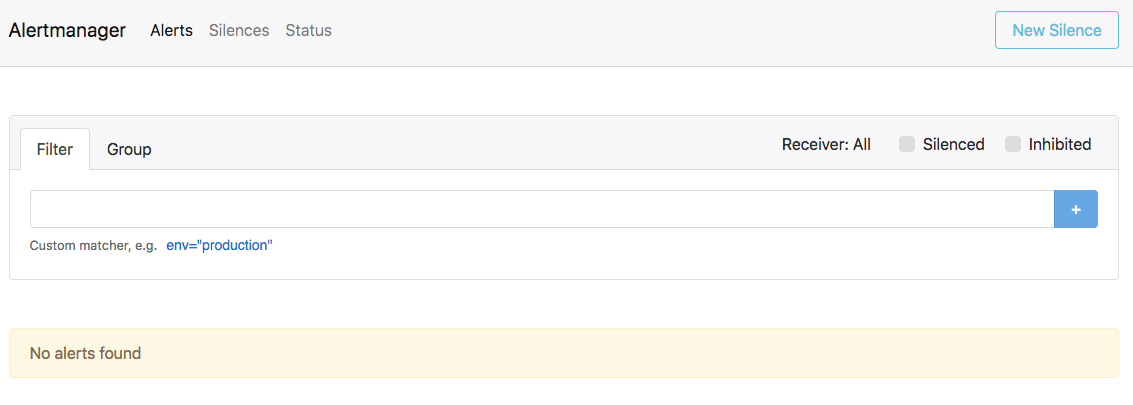
Port-forward from your local machine to the pod running Alertmanager:
$ kubectl port-forward alertmanager-cockroachdb-0 9093Go to http://localhost:9093 in your browser. The screen should look like this:
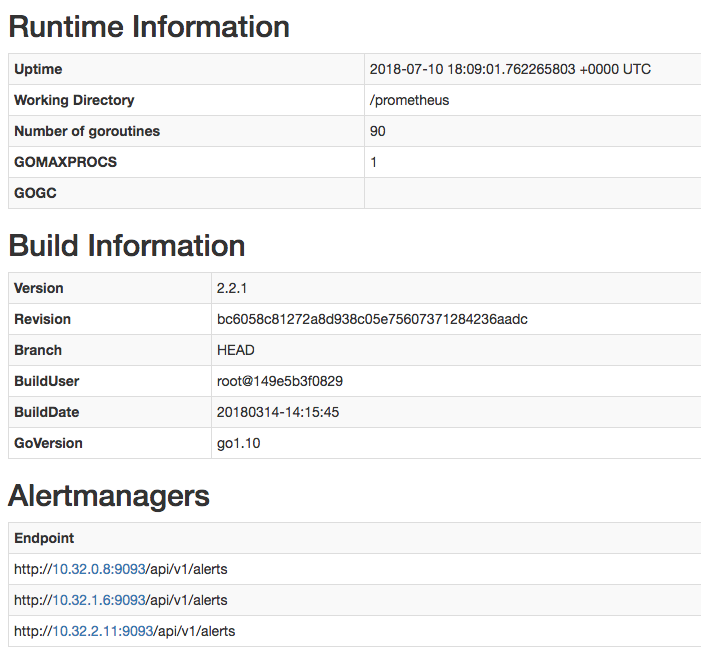
Ensure that the Alertmanagers are visible to Prometheus by opening http://localhost:9090/status. The screen should look like this:
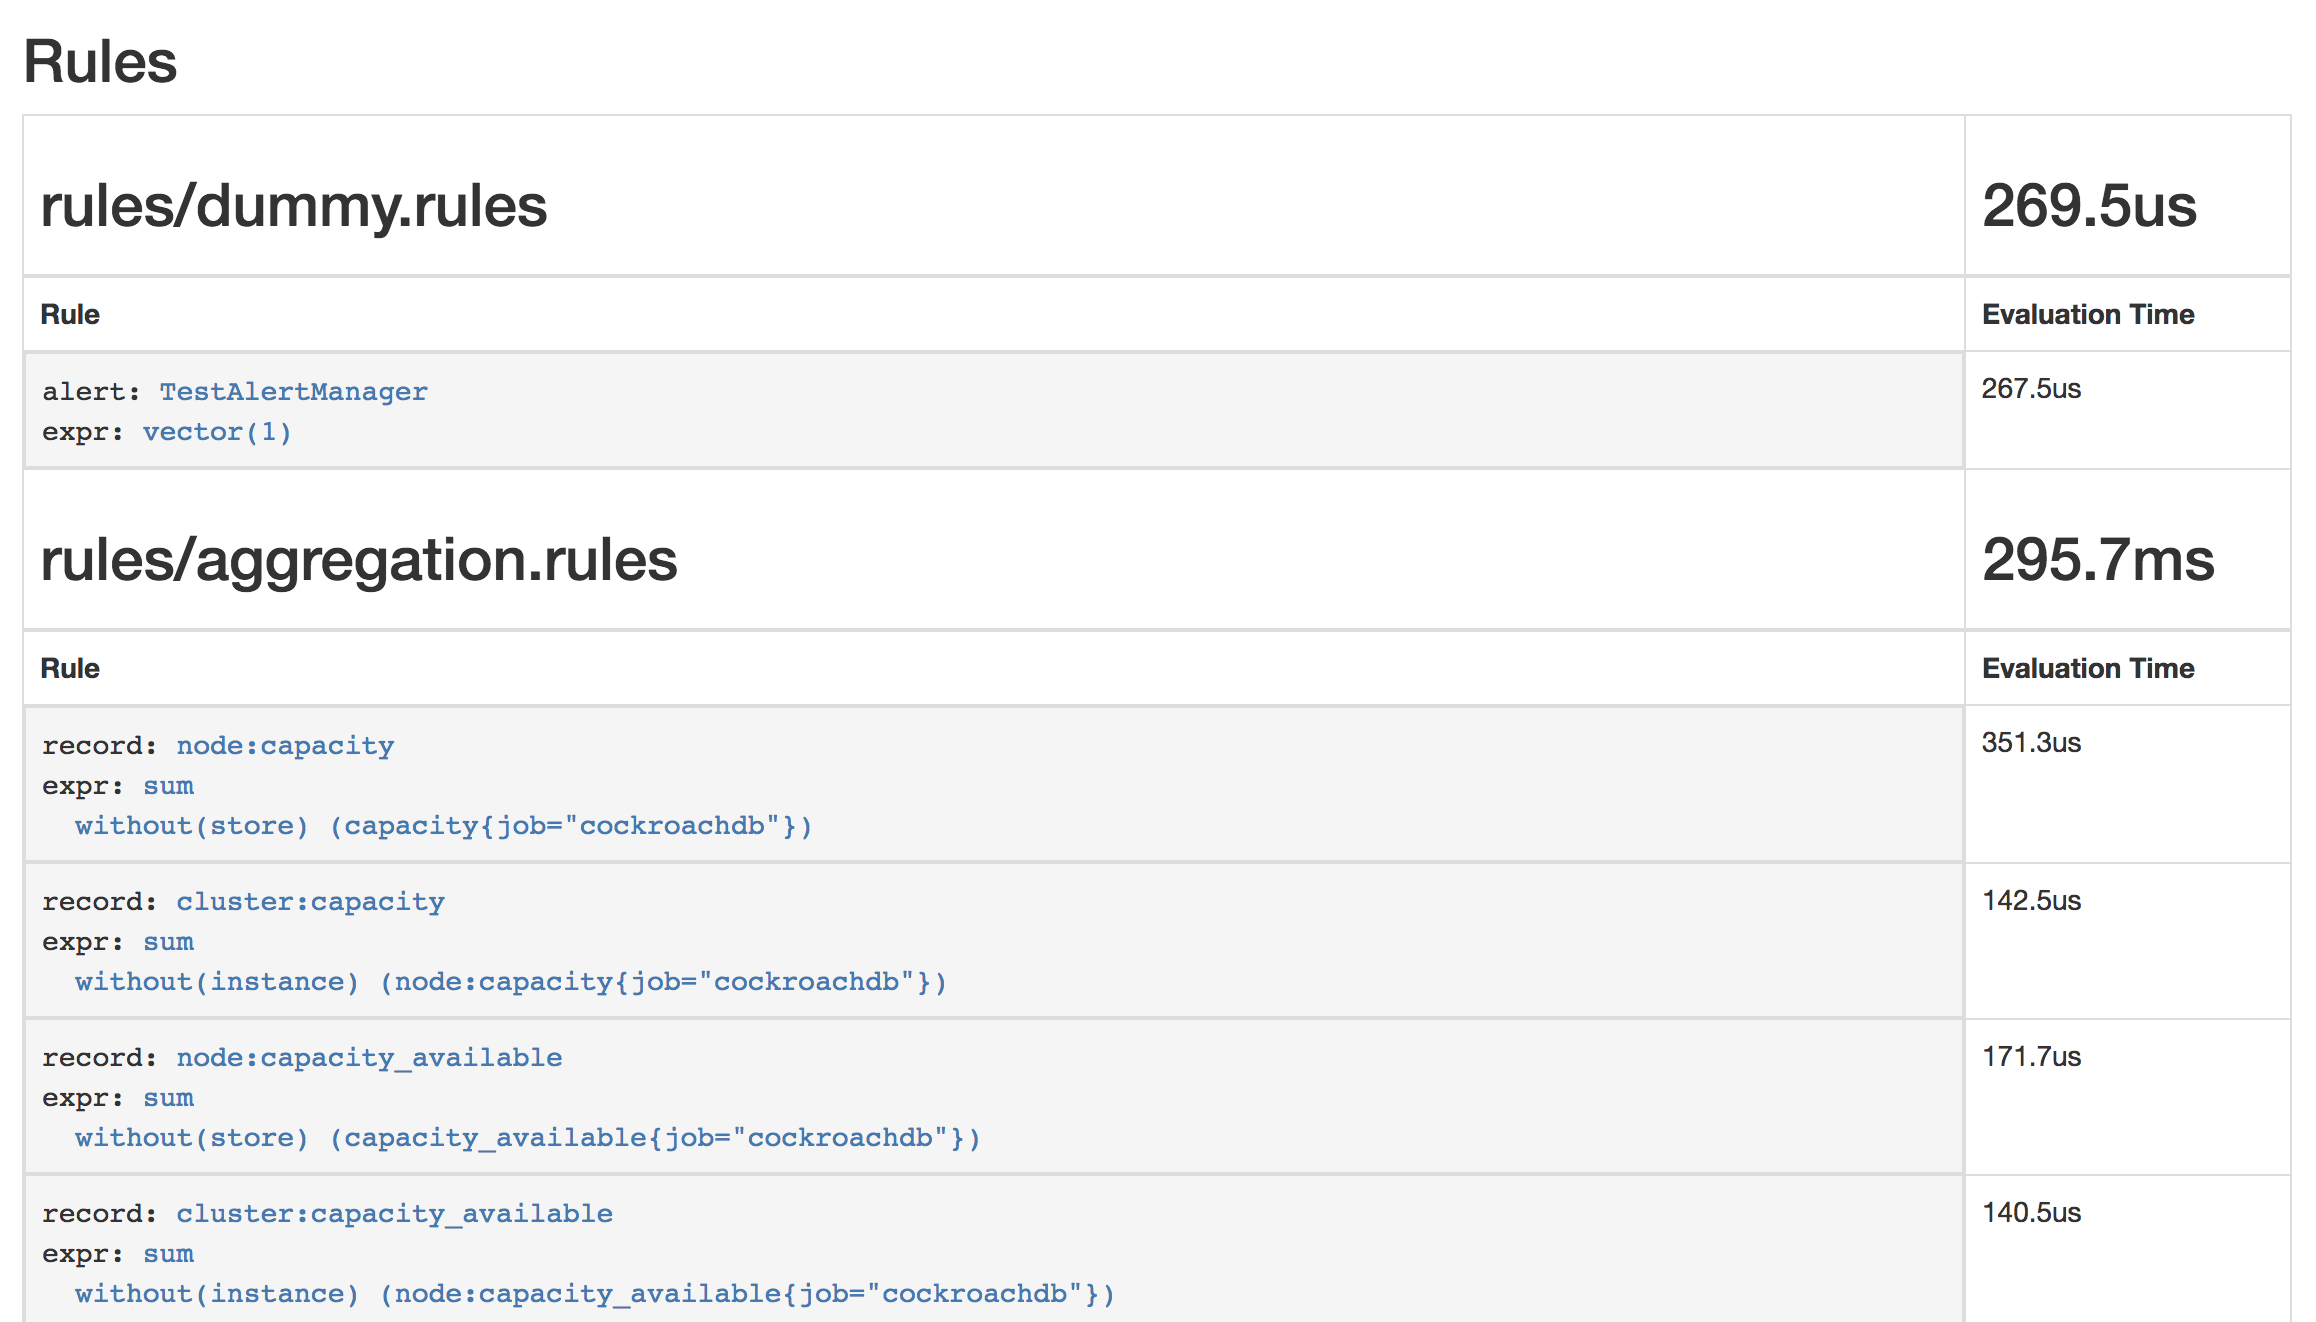
Add CockroachDB's starter alerting rules:
$ kubectl apply -f https://raw.githubusercontent.com/cockroachdb/cockroach/master/cloud/kubernetes/prometheus/alert-rules.yamlprometheusrule "prometheus-cockroachdb-rules" createdEnsure that the rules are visible to Prometheus by opening http://localhost:9090/status http://localhost:9090/rules. The screen should look like this:
Verify that the example alert is firing by opening http://localhost:9090/alerts. The screen should look like this:
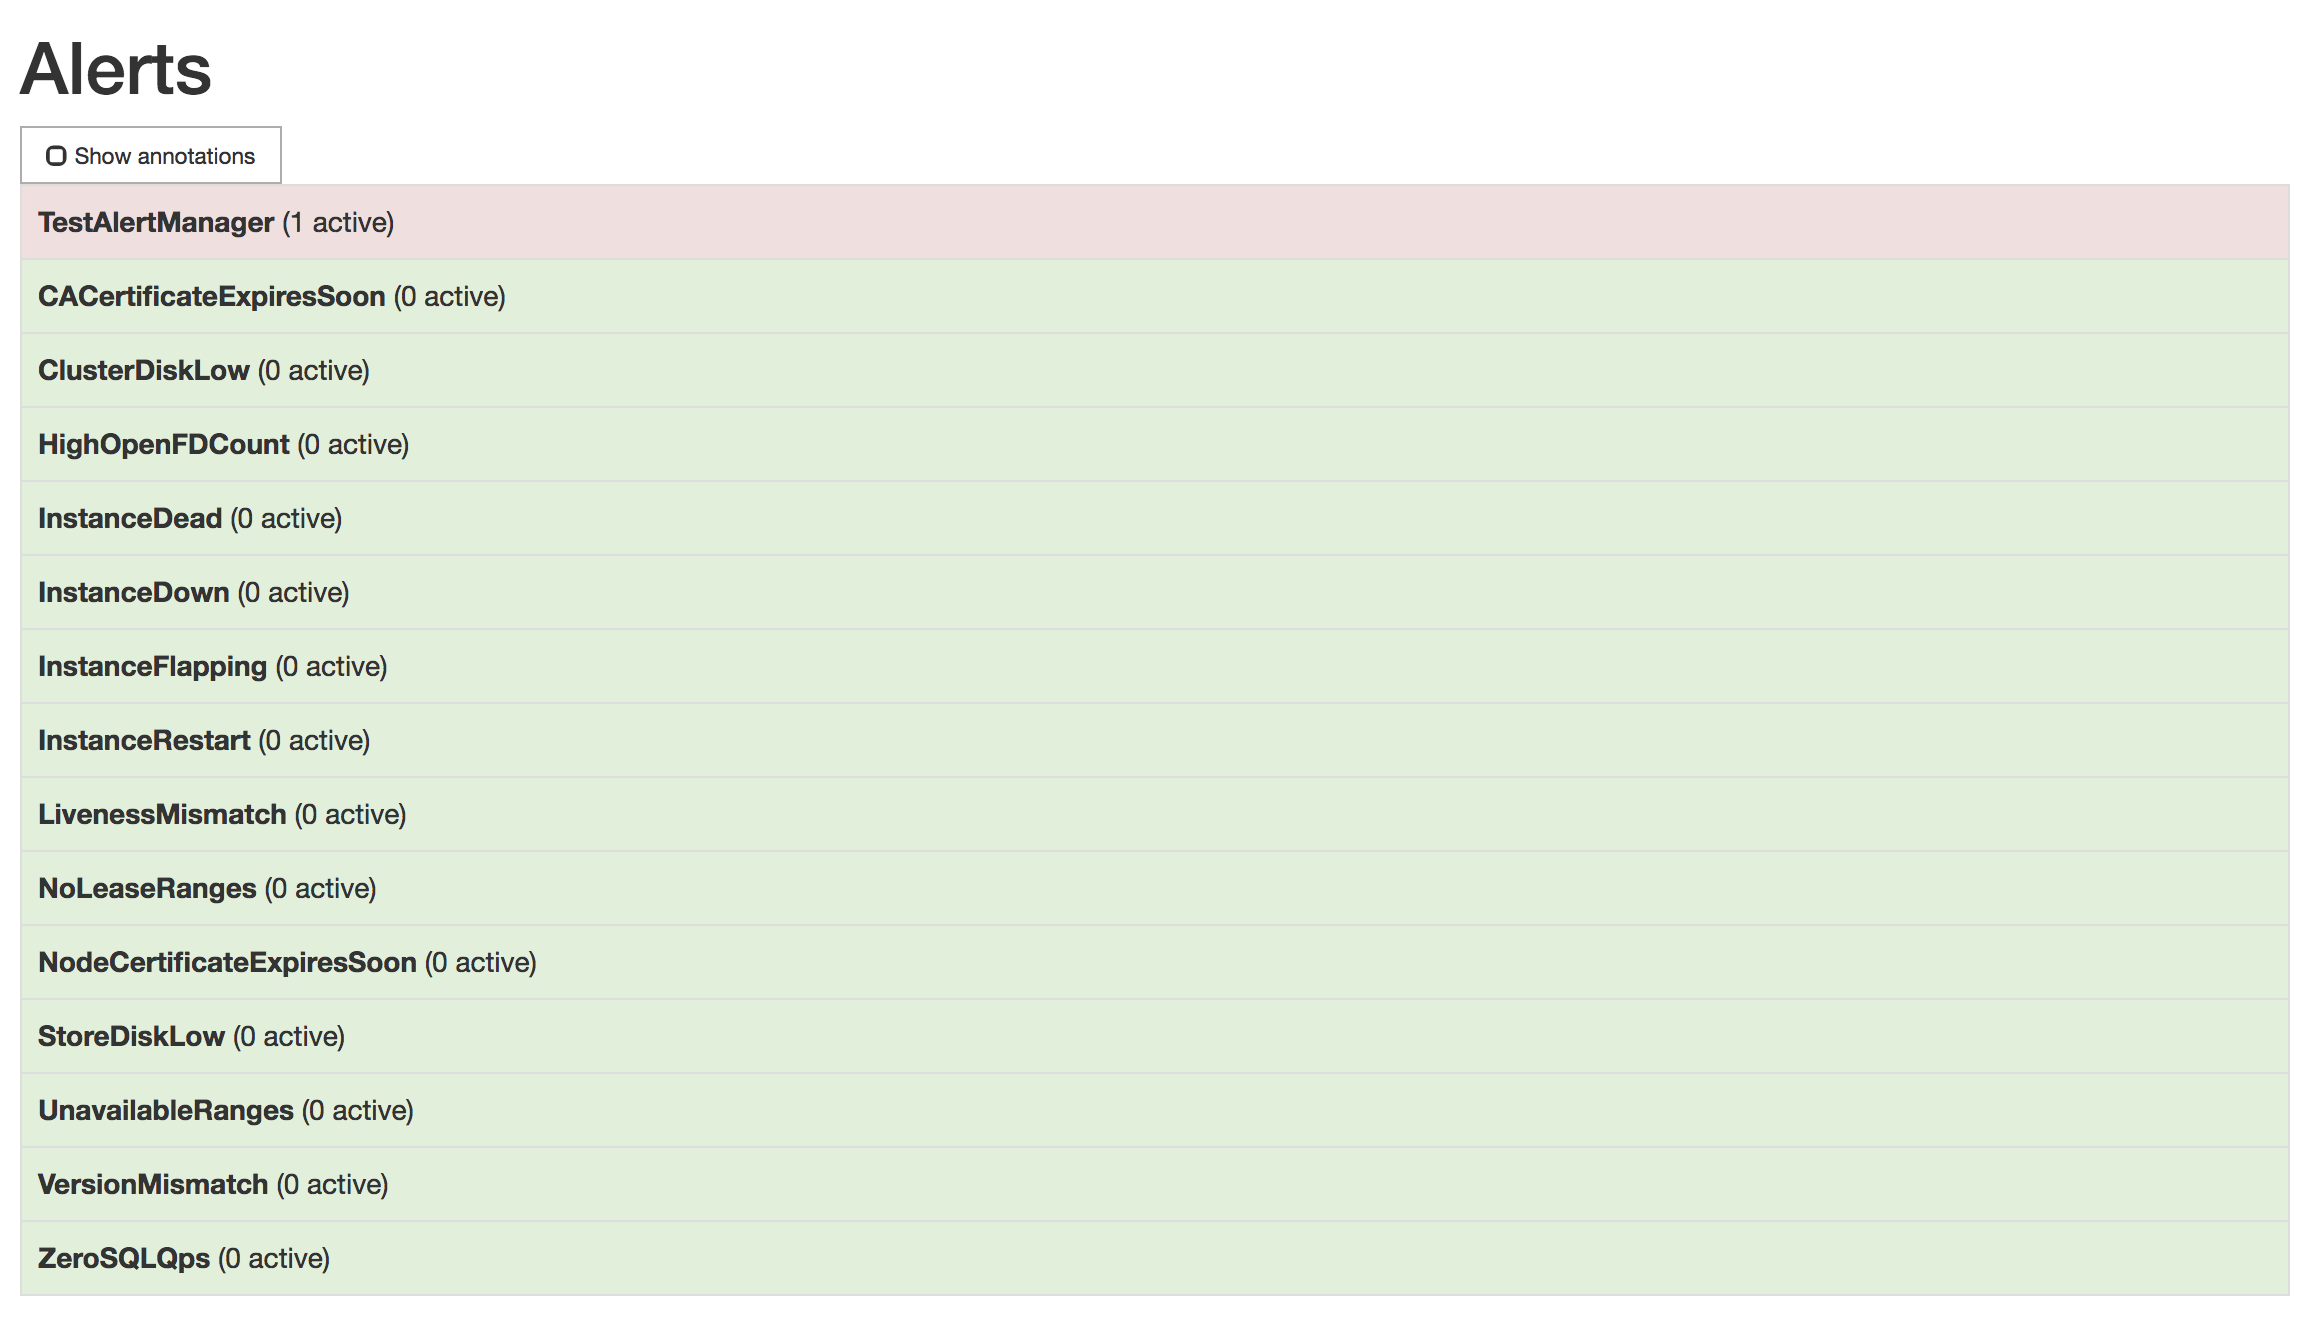
To remove the example alert:
Use the
kubectl editcommand to open the rules for editing:$ kubectl edit prometheusrules prometheus-cockroachdb-rulesRemove the
dummy.rulesblock and save the file:- name: rules/dummy.rules rules: - alert: TestAlertManager expr: vector(1)
Step 8. Maintain the cluster
Scale the cluster
The Kubernetes cluster we created contains 3 nodes that pods can be run on. To ensure that you do not have two pods on the same node (as recommended in our production best practices), you need to add a new node and then edit your StatefulSet configuration to add another pod.
Add a worker node:
- On GKE, resize your cluster.
- On GCE, resize your Managed Instance Group.
- On AWS, resize your Auto Scaling Group.
Use the
kubectl scalecommand to add a pod to your StatefulSet:$ kubectl scale statefulset cockroachdb --replicas=4statefulset "cockroachdb" scaledVerify that a fourth pod was added successfully:
$ kubectl get podsNAME READY STATUS RESTARTS AGE alertmanager-cockroachdb-0 2/2 Running 0 2m alertmanager-cockroachdb-1 2/2 Running 0 2m alertmanager-cockroachdb-2 2/2 Running 0 2m cockroachdb-0 1/1 Running 0 9m cockroachdb-1 1/1 Running 0 9m cockroachdb-2 1/1 Running 0 7m cockroachdb-3 0/1 Pending 0 5s prometheus-cockroachdb-0 3/3 Running 1 5m prometheus-operator-85dd478dbb-66lvb 1/1 Running 0 6m
Upgrade the cluster
As new versions of CockroachDB are released, it's strongly recommended to upgrade to newer versions in order to pick up bug fixes, performance improvements, and new features. The general CockroachDB upgrade documentation provides best practices for how to prepare for and execute upgrades of CockroachDB clusters, but the mechanism of actually stopping and restarting processes in Kubernetes is somewhat special.
Kubernetes knows how to carry out a safe rolling upgrade process of the CockroachDB nodes. When you tell it to change the Docker image used in the CockroachDB StatefulSet, Kubernetes will go one-by-one, stopping a node, restarting it with the new image, and waiting for it to be ready to receive client requests before moving on to the next one. For more information, see the Kubernetes documentation.
All that it takes to kick off this process is changing the desired Docker image. To do so, pick the version that you want to upgrade to, then run the following command, replacing "VERSION" with your desired new version:
$ kubectl patch statefulset cockroachdb --type='json' -p='[{"op": "replace", "path": "/spec/template/spec/containers/0/image", "value":"cockroachdb/cockroach:VERSION"}]'statefulset "cockroachdb" patchedIf you then check the status of your cluster's pods, you should see one of them being restarted:
$ kubectl get podsNAME READY STATUS RESTARTS AGE cockroachdb-0 1/1 Running 0 2m cockroachdb-1 1/1 Running 0 2m cockroachdb-2 1/1 Running 0 2m cockroachdb-3 0/1 Terminating 0 1mThis will continue until all of the pods have restarted and are running the new image. To check the image of each pod to determine whether they've all be upgraded, run:
$ kubectl get pods -o jsonpath='{range .items[*]}{.metadata.name}{"\t"}{.spec.containers[0].image}{"\n"}'cockroachdb-0 cockroachdb/cockroach:v2.0.7 cockroachdb-1 cockroachdb/cockroach:v2.0.7 cockroachdb-2 cockroachdb/cockroach:v2.0.7 cockroachdb-3 cockroachdb/cockroach:v2.0.7
Stop the cluster
To shut down the CockroachDB cluster:
Delete all of the resources you created, including the logs and remote persistent volumes:
$ kubectl delete pods,statefulsets,services,persistentvolumeclaims,persistentvolumes,poddisruptionbudget,jobs,rolebinding,clusterrolebinding,role,clusterrole,serviceaccount,alertmanager,prometheus,prometheusrule,serviceMonitor -l app=cockroachdbpod "cockroachdb-0" deleted pod "cockroachdb-1" deleted pod "cockroachdb-2" deleted pod "cockroachdb-3" deleted service "alertmanager-cockroachdb" deleted service "cockroachdb" deleted service "cockroachdb-public" deleted persistentvolumeclaim "datadir-cockroachdb-0" deleted persistentvolumeclaim "datadir-cockroachdb-1" deleted persistentvolumeclaim "datadir-cockroachdb-2" deleted persistentvolumeclaim "datadir-cockroachdb-3" deleted poddisruptionbudget "cockroachdb-budget" deleted job "cluster-init" deleted clusterrolebinding "prometheus" deleted clusterrole "prometheus" deleted serviceaccount "prometheus" deleted alertmanager "cockroachdb" deleted prometheus "cockroachdb" deleted prometheusrule "prometheus-cockroachdb-rules" deleted servicemonitor "cockroachdb" deletedStop Kubernetes:
$ gcloud container clusters delete cockroachdb$ cluster/kube-down.sh$ cluster/kube-down.shWarning:If you stop Kubernetes without first deleting the persistent volumes, they will still exist in your cloud project.