If a SQL statement returns an unexpected result or takes longer than expected to process, this page will help you troubleshoot the issue.
For a developer-centric walkthrough of optimizing SQL query performance, see Optimize Query Performance.
Identify slow queries
Use the slow query log or Admin UI to detect slow queries in your cluster.
Using the slow query log
New in v20.1: The slow query log is a record of SQL queries whose service latency exceeds a specified threshold value. When the sql.log.slow_query.latency_threshold cluster setting is set to a non-zero value, each gateway node will log slow SQL queries to a secondary log file cockroach-sql-slow.log in the log directory.
Service latency is the time taken to execute a query once it is received by the cluster. It does not include the time taken to send the query to the cluster or return the result to the client.
Run the
cockroach sqlcommand against one of your nodes. This opens the interactive SQL shell.Set the
sql.log.slow_query.latency_thresholdcluster setting to a threshold of your choosing. For example, 100 milliseconds represents the limit where a user feels the system is reacting instantaneously.> SET CLUSTER SETTING sql.log.slow_query.latency_threshold = '100ms';Each node's slow query log is written by default in CockroachDB's standard log directory.
When you open a slow query log, look for a line that corresponds to your earlier
SET CLUSTER SETTINGcommand:I200325 19:24:10.079675 380825 sql/exec_log.go:193 [n1,client=127.0.0.1:49712,hostnossl,user=root] 1532 9.217ms exec "$ cockroach sql" {} "SET CLUSTER SETTING \"sql.log.slow_query.latency_threshold\" = '100ms'" {} 0 "" 0Slow queries will be logged after this line.
The slow query log generally shares the SQL audit log file format. One exception is that service latency is found between the log entry counter and log message.
For example, the below query was logged with a service latency of 166.807 milliseconds:
I200325 21:57:08.733963 388888 sql/exec_log.go:193 [n1,client=127.0.0.1:53663,hostnossl,user=root] 400 166.807ms exec "" {} "UPSERT INTO vehicle_location_histories VALUES ($1, $2, now(), $3, $4)" {$1:"'washington dc'", $2:"'c9e93223-fb27-4014-91ce-c60758476580'", $3:"-29.0", $4:"45.0"} 1 "" 0
Setting sql.log.slow_query.latency_threshold to a non-zero value enables tracing on all queries, which impacts performance. After debugging, set the value back to 0s to disable the log.
Log files can be accessed using the Admin UI, which displays them in JSON format.
Access the Admin UI and then click Advanced Debug in the left-hand navigation.
Under Raw Status Endpoints (JSON), click Log Files to view the JSON of all collected logs.
Copy one of the log filenames. Then click Specific Log File and replace the
cockroach.logplaceholder in the URL with the filename.
Using the Admin UI
High latency SQL statements are displayed on the Statements page of the Admin UI. To view the Statements page, access the Admin UI and click Statements on the left.
You can also check the service latency graph and the CPU graph on the SQL and Hardware Dashboards, respectively. If the graphs show latency spikes or CPU usage spikes, these might indicate slow queries in your cluster.
Visualize statement traces in Jaeger
You can look more closely at the behavior of a statement by visualizing a statement trace in Jaeger. A statement trace contains messages and timing information from all nodes involved in the execution.
Activate statement diagnostics on the Admin UI Statements Page or run
EXPLAIN ANALYZE (DEBUG)to obtain a diagnostics bundle for the statement.Start Jaeger:
docker run -d --name jaeger -p 16686:16686 jaegertracing/all-in-one:1.17
Access the Jaeger UI at
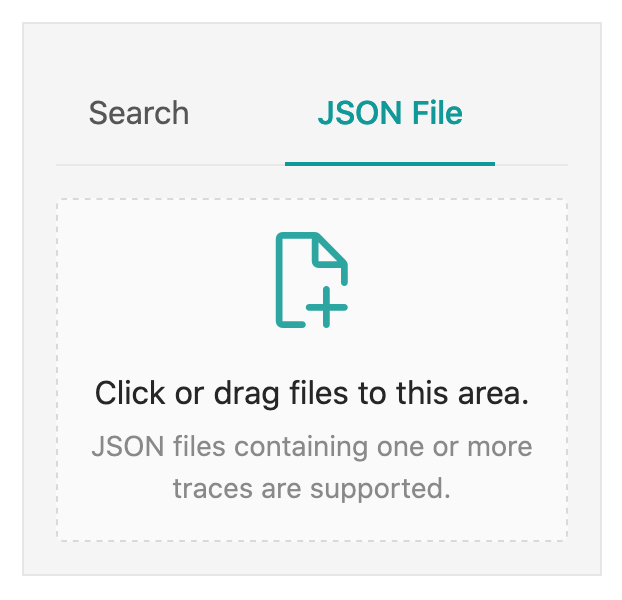
http://localhost:16686/search.Click on JSON File in the Jaeger UI and upload
trace-jaeger.jsonfrom the diagnostics bundle. The trace will appear in the list on the right.
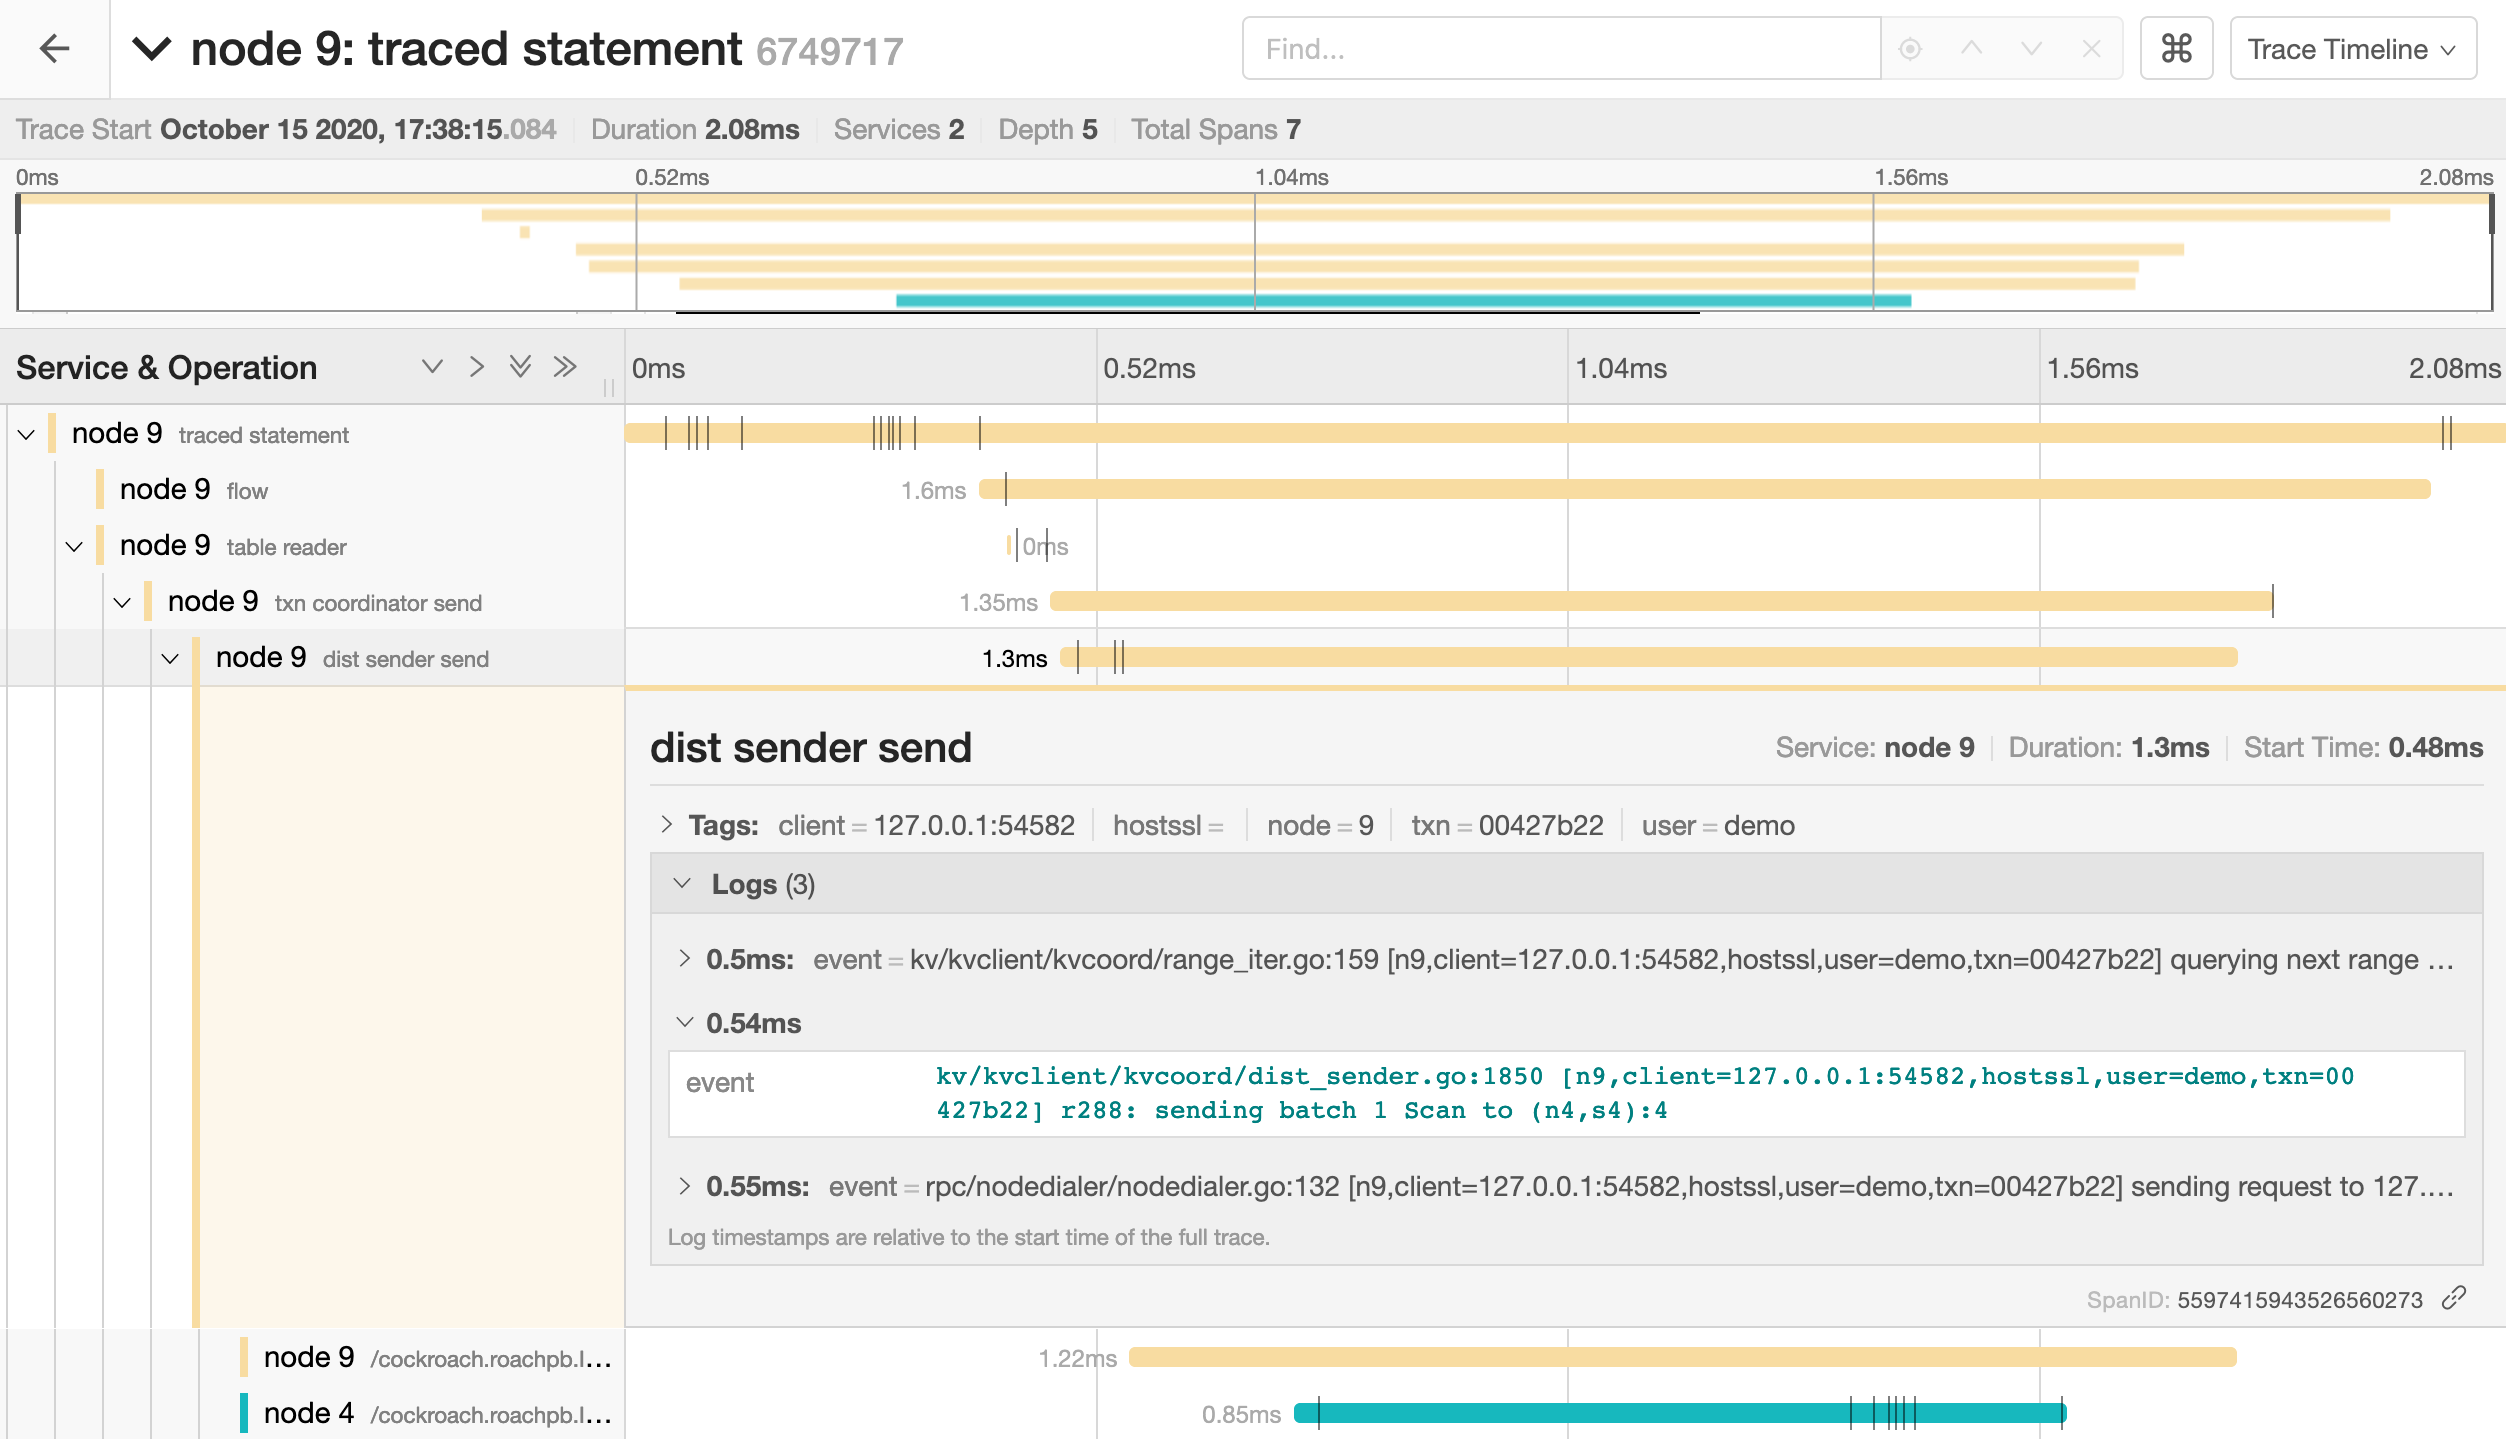
Click on the trace to view its details. It is visualized as a collection of spans with timestamps. These may include operations executed by different nodes.

The full timeline displays the execution time and execution phases for the statement.
Click on a span to view details for that span and log messages.

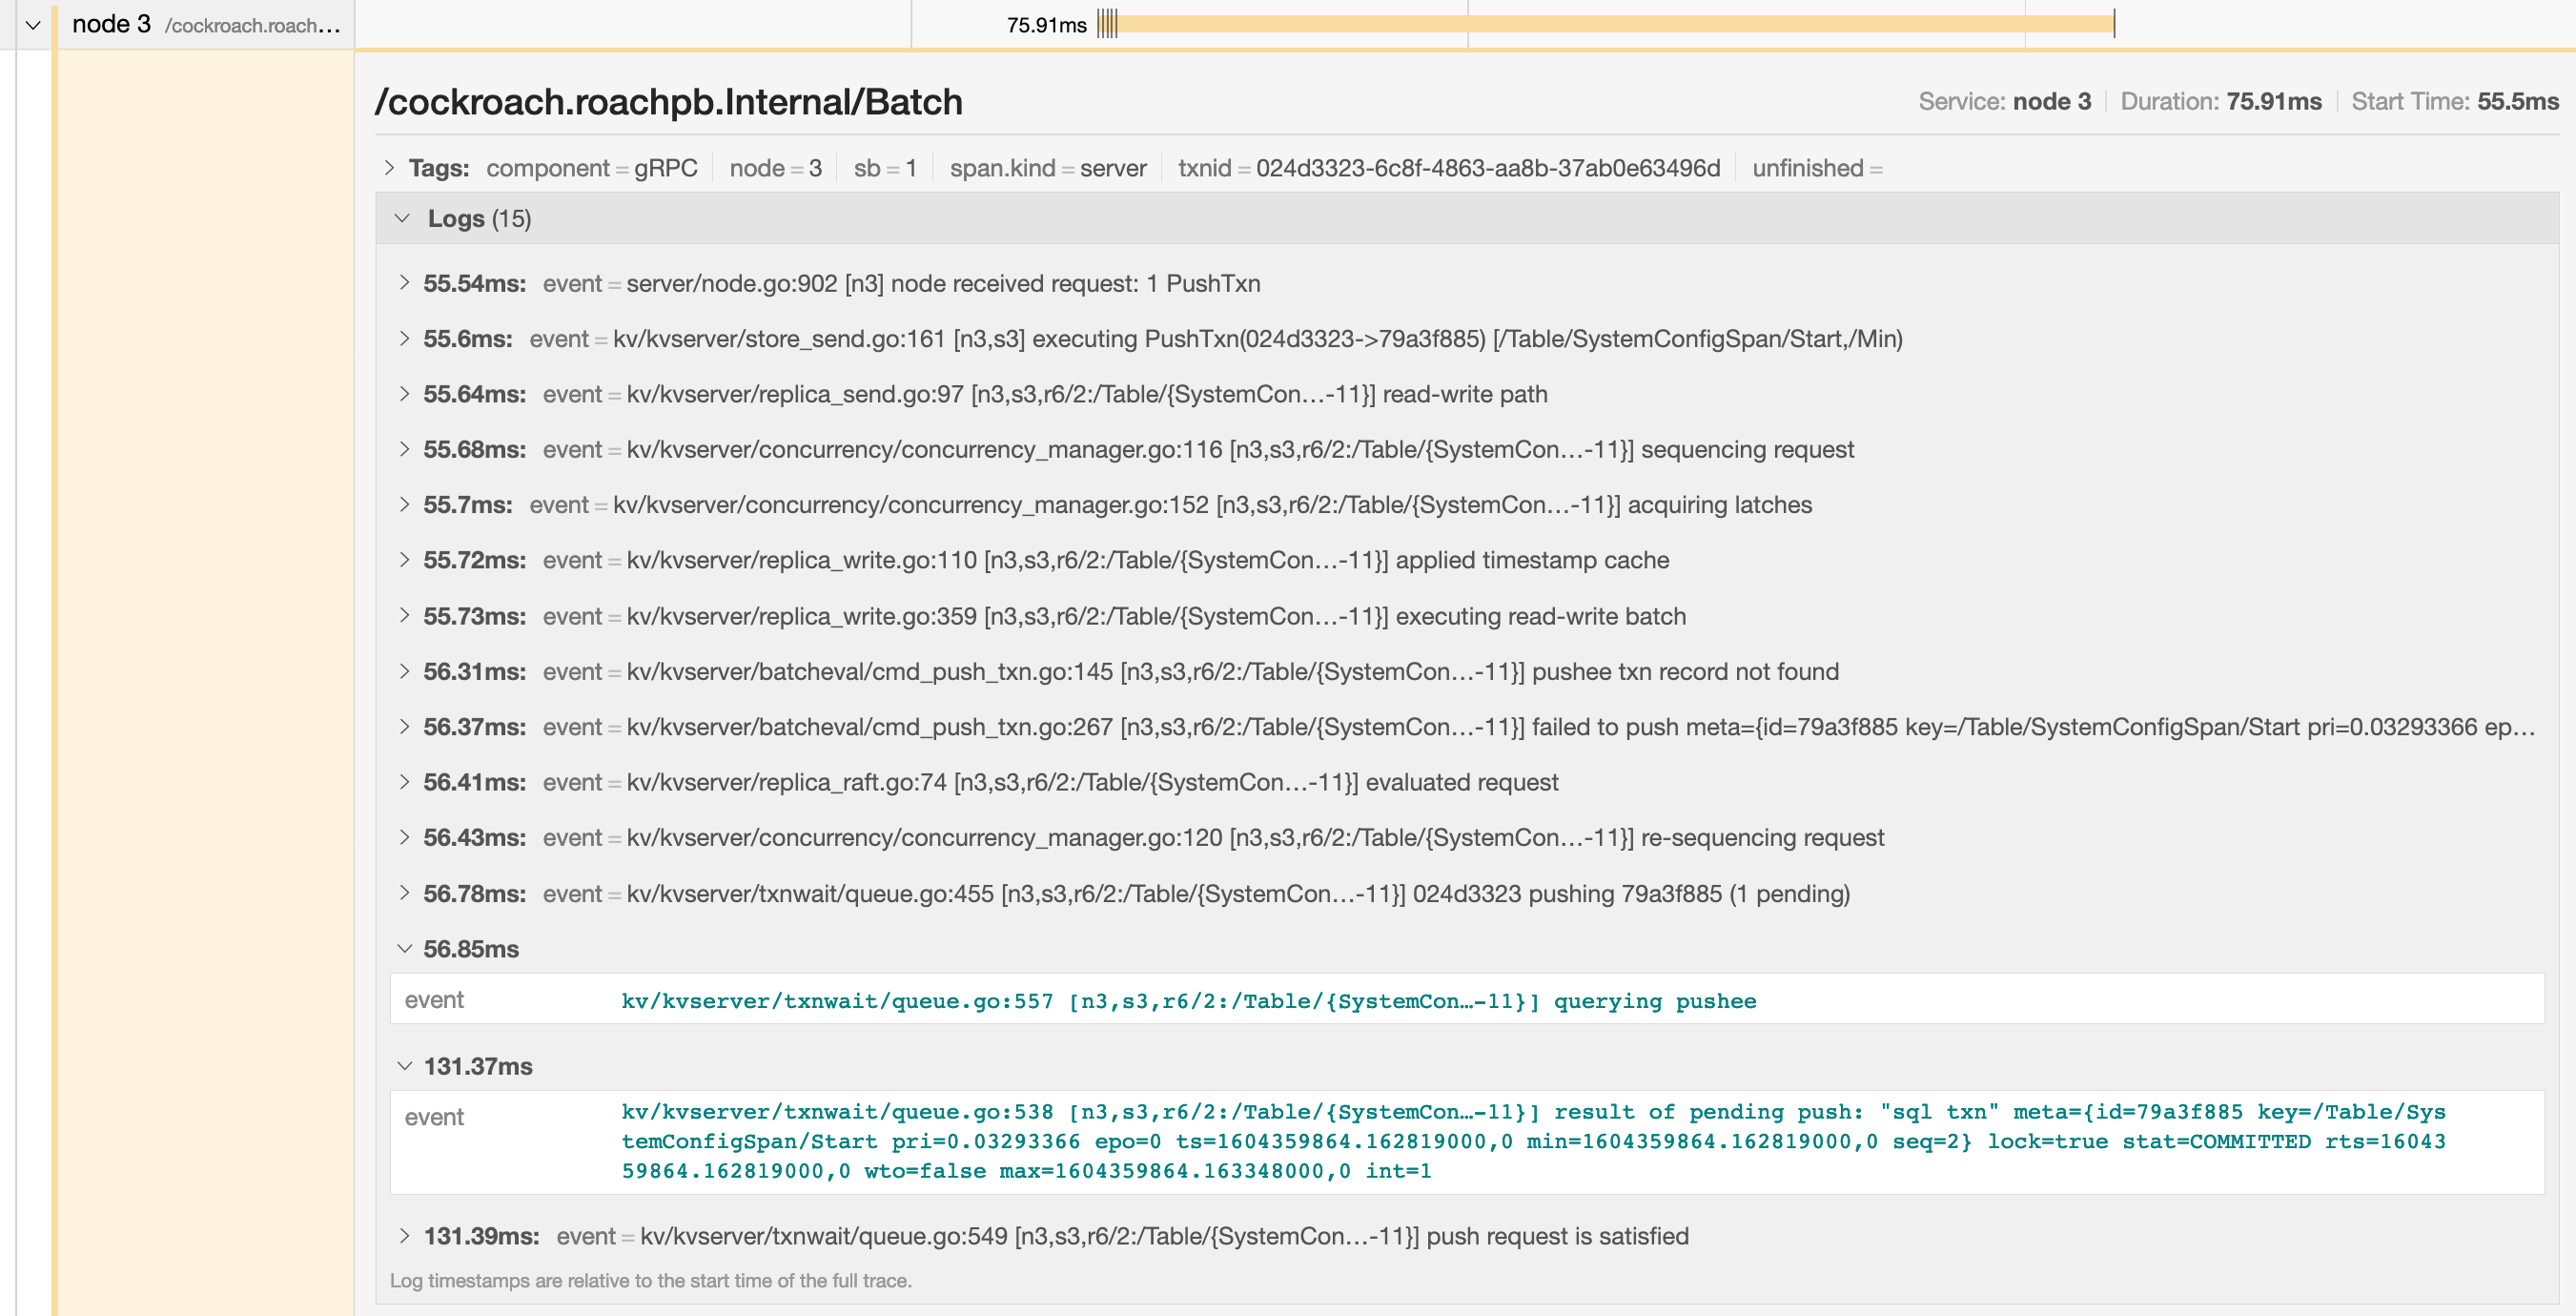
You can troubleshoot transaction contention, for example, by gathering diagnostics on statements with high latency and looking through the log messages in
trace-jaeger.jsonfor jumps in latency.In the example below, the trace shows that there is significant latency between a push attempt on a transaction that is holding a lock (56.85ms) and that transaction being committed (131.37ms).

SELECT statement performance issues
The common reasons for a sub-optimal SELECT performance are inefficient scans, full scans, and incorrect use of indexes. To improve the performance of SELECT statements, refer to the following documents:
Query is always slow
If you have consistently slow queries in your cluster, use the Statement Details page to drill down to an individual statement and collect diagnostics for the statement. A diagnostics bundle contains a record of transaction events across nodes for the SQL statement.
You can also use an EXPLAIN ANALYZE statement, which executes a SQL query and returns a physical query plan with execution statistics. Query plans can be used to troubleshoot slow queries by indicating where time is being spent, how long a processor (i.e., a component that takes streams of input rows and processes them according to a specification) is not doing work, etc.
We recommend sending either the diagnostics bundle or the EXPLAIN ANALYZE output to our support team for analysis.
Query is sometimes slow
If the query performance is irregular:
Run
SHOW TRACEfor the query twice: once when the query is performing as expected and once when the query is slow.Contact us to analyze the outputs of the
SHOW TRACEcommand.
Cancelling running queries
See Cancel query
Low throughput
Throughput is affected by the disk I/O, CPU usage, and network latency. Use the Admin UI to check the following metrics:
Disk I/O: Disk IOPS in progress
CPU usage: CPU percent
Network latency: Network Latency page
Single hot node
A hot node is one that has much higher resource usage than other nodes. To determine if you have a hot node in your cluster, access the Admin UI, click Metrics on the left, and navigate to the following graphs. Hover over each of the following graphs to see the per-node values of the metrics. If one of the nodes has a higher value, you have a hot node in your cluster.
Replication dashboard > Average queries per store graph.
Overview Dashboard > Service Latency graph
Hardware Dashboard > CPU percent graph
SQL Dashboard > SQL Connections graph
Hardware Dashboard > Disk IOPS in Progress graph
Solution:
If you have a small table that fits into one range, then only one of the nodes will be used. This is expected behavior. However, you can split your range to distribute the table across multiple nodes.
If the SQL Connections graph shows that one node has a higher number of SQL connections and other nodes have zero connections, check if your app is set to talk to only one node.
Check load balancer settings.
Check for transaction contention.
If you have a monotonically increasing index column or Primary Key, then your index or Primary Key should be redesigned. See Unique ID best practices for more information.
INSERT/UPDATE statements are slow
Use the Statements page to identify the slow SQL statements. To view the Statements page, access the Admin UI and then click Statements on the left.
Refer to the following documents to improve INSERT / UPDATE performance:
Per-node queries per second (QPS) is high
If a cluster is not idle, it is useful to monitor the per-node queries per second. Cockroach will automatically distribute load throughout the cluster. If one or more nodes is not performing any queries there is likely something to investigate. See exec_success and exec_errors which track operations at the KV layer and sql_{select,insert,update,delete}_count which track operations at the SQL layer.
Increasing number of nodes does not improve performance
See Why would increasing the number of nodes not result in more operations per second?
bad connection & closed responses
If you receive a response of bad connection or closed, this normally indicates that the node you connected to died. You can check this by connecting to another node in the cluster and running cockroach node status.
Once you find the downed node, you can check its logs (stored in cockroach-data/logs by default).
Because this kind of behavior is entirely unexpected, you should file an issue.
SQL logging
There are several ways to log SQL queries. The type of logging to use depends on your requirements and on the purpose of the logs.
- For system troubleshooting and performance optimization, turn on cluster-wide execution logs.
- For local testing, turn on per-node execution logs.
- For per-table audit logs for security purposes, turn on SQL audit logs.
Cluster-wide execution logs
For production clusters, the best way to log all queries is to turn on the cluster-wide setting sql.trace.log_statement_execute:
> SET CLUSTER SETTING sql.trace.log_statement_execute = true;
With this setting on, each node of the cluster writes all SQL queries it executes to a secondary cockroach-sql-exec log file. Use the symlink cockroach-sql-exec.log to open the most recent log. When you no longer need to log queries, you can turn the setting back off:
> SET CLUSTER SETTING sql.trace.log_statement_execute = false;
Log files are written to CockroachDB's standard log directory.
Slow query logs
New in v20.1: The sql.log.slow_query.latency_threshold cluster setting is used to log only queries whose service latency exceeds a specified threshold value (e.g., 100 milliseconds):
> SET CLUSTER SETTING sql.log.slow_query.latency_threshold = '100ms';
Each node that serves as a gateway will then record slow SQL queries to a cockroach-sql-slow log file. Use the symlink cockroach-sql-slow.log to open the most recent log. For more details on logging slow queries, see Using the slow query log.
Setting sql.log.slow_query.latency_threshold to a non-zero value enables tracing on all queries, which impacts performance. After debugging, set the value back to 0s to disable the log.
Log files are written to CockroachDB's standard log directory.
Authentication logs
This is an experimental feature. The interface and output are subject to change.
SQL client connections can be logged by turning on the server.auth_log.sql_connections.enabled cluster setting:
> SET CLUSTER SETTING server.auth_log.sql_connections.enabled = true;
This will log connection established and connection terminated events to a cockroach-auth log file. Use the symlink cockroach-auth.log to open the most recent log.
In addition to SQL sessions, connection events can include SQL-based liveness probe attempts, as well as attempts to use the PostgreSQL cancel protocol.
This example log shows both types of connection events over a hostssl (TLS certificate over TCP) connection:
I200219 05:08:43.083907 5235 sql/pgwire/server.go:445  [n1,client=[::1]:34588] 22 received connection
I200219 05:08:44.171384 5235 sql/pgwire/server.go:453  [n1,client=[::1]:34588,hostssl] 26 disconnected; duration: 1.087489893s
Along with the above, SQL client authenticated sessions can be logged by turning on the server.auth_log.sql_sessions.enabled cluster setting:
> SET CLUSTER SETTING server.auth_log.sql_sessions.enabled = true;
This logs authentication method selection, authentication method application, authentication method result, and session termination events to the cockroach-auth log file. Use the symlink cockroach-auth.log to open the most recent log.
This example log shows authentication success over a hostssl (TLS certificate over TCP) connection:
I200219 05:08:43.089501 5149 sql/pgwire/auth.go:327  [n1,client=[::1]:34588,hostssl,user=root] 23 connection matches HBA rule:
# TYPE DATABASE USER ADDRESS METHOD        OPTIONS
host   all      root all     cert-password
I200219 05:08:43.091045 5149 sql/pgwire/auth.go:327  [n1,client=[::1]:34588,hostssl,user=root] 24 authentication succeeded
I200219 05:08:44.169684 5235 sql/pgwire/conn.go:216  [n1,client=[::1]:34588,hostssl,user=root] 25 session terminated; duration: 1.080240961s
This example log shows authentication failure log over a local (password over Unix socket) connection:
I200219 05:02:18.148961 1037 sql/pgwire/auth.go:327  [n1,client,local,user=root] 17 connection matches HBA rule:
# TYPE DATABASE USER ADDRESS METHOD   OPTIONS
local  all      all          password
I200219 05:02:18.151644 1037 sql/pgwire/auth.go:327  [n1,client,local,user=root] 18 user has no password defined
I200219 05:02:18.152863 1037 sql/pgwire/auth.go:327  [n1,client,local,user=root] 19 authentication failed: password authentication failed for user root
I200219 05:02:18.154168 1036 sql/pgwire/conn.go:216  [n1,client,local,user=root] 20 session terminated; duration: 5.261538ms
For complete logging of client connections, we recommend enabling both server.auth_log.sql_connections.enabled and server.auth_log.sql_sessions.enabled.
Be aware that both logs perform one disk I/O per event and will impact performance when enabled.
For more details on authentication and certificates, see Authentication.
Log files are written to CockroachDB's standard log directory.
Per-node execution logs
Alternatively, if you are testing CockroachDB locally and want to log queries executed just by a specific node, you can either pass a CLI flag at node startup, or execute a SQL function on a running node.
Using the CLI to start a new node, pass the --vmodule flag to the cockroach start command. For example, to start a single node locally and log all client-generated SQL queries it executes, you'd run:
$ cockroach start --insecure --listen-addr=localhost --vmodule=exec_log=2 --join=<join addresses>
To log CockroachDB-generated SQL queries as well, use --vmodule=exec_log=3.
From the SQL prompt on a running node, execute the crdb_internal.set_vmodule() function:
> SELECT crdb_internal.set_vmodule('exec_log=2');
This will result in the following output:
  crdb_internal.set_vmodule
+---------------------------+
                          0
(1 row)
Once the logging is enabled, all client-generated SQL queries executed by the node will be written to the primary CockroachDB log file as follows:
I180402 19:12:28.112957 394661 sql/exec_log.go:173 [n1,client=127.0.0.1:50155,user=root] exec "psql" {} "SELECT version()" {} 0.795 1 ""
SQL audit logs
This is an experimental feature. The interface and output are subject to change.
SQL audit logging is useful if you want to log all queries that are run against specific tables, by specific users.
For a tutorial, see SQL Audit Logging.
For reference documentation, see
ALTER TABLE ... EXPERIMENTAL_AUDIT.
Note that enabling SQL audit logs can negatively impact performance. As a result, we recommend using SQL audit logs for security purposes only.
Something else?
Try searching the rest of our docs for answers or using our other support resources, including: